(AUTHOR: Allan Krisciunas / GIS @ CMHC / Ottawa, Canada)
One major advantage of raster GIS in housing market studies is that raster lends itself to complex mathematical analysis not possible in vector GIS. For instance, trend surface polynomial expressions can be developed (ie: multiple regression equations, where the independent variables are latitude & longitude, a common tool in economic geography) that allow one to create models of geographic behaviour, and predict unknown values based on known inputs. One could, for example, use raster GIS to project changes in apartment rent levels by calculating a trend-surface model that included, besides lat/long, the underlying demographic information.
The images below demonstrate how rent may be stored in a raster GIS. The following steps describe how the maps were created :
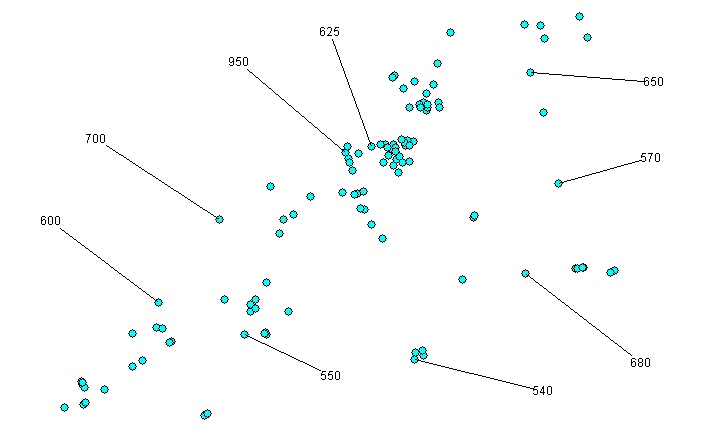
These are the "source"
vector
point data. Note the random sampling of average one-bedroom rents
associated with different apartment buildings.
 |
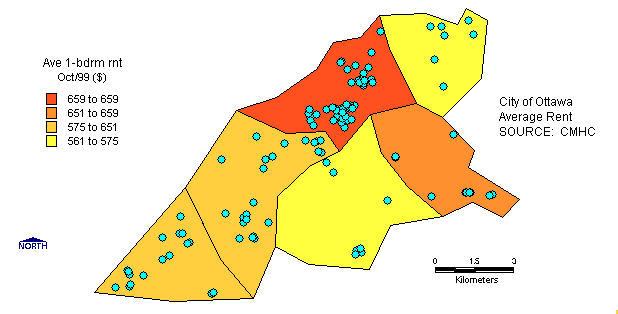
The next image represents
one way that the above vector point data may be represented by vector polygons:
 |
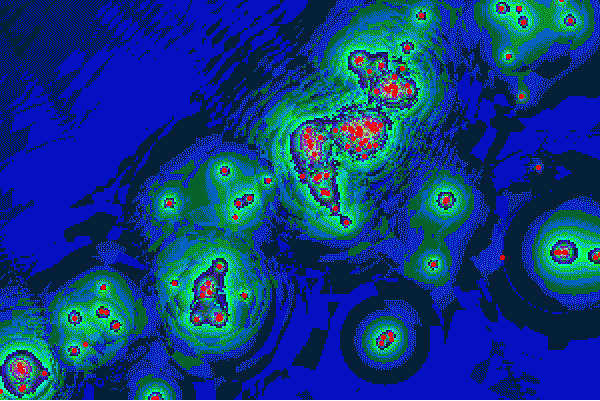
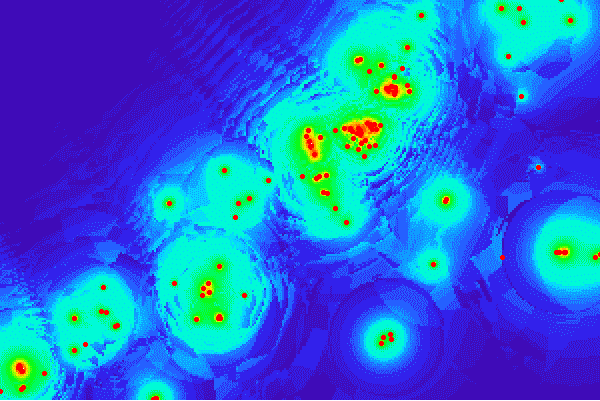
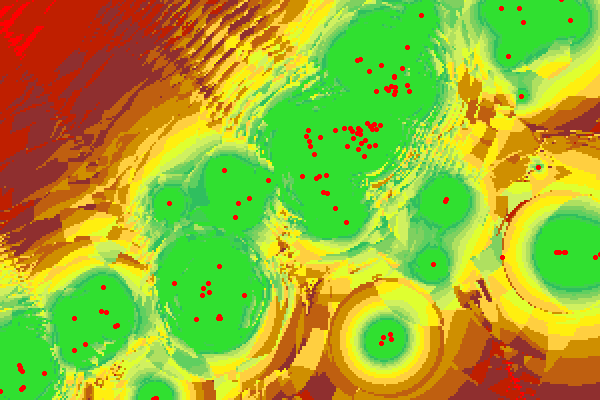
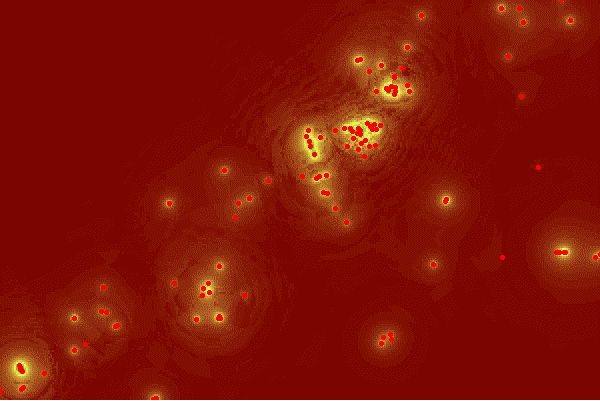
The following 4
images represent different possible raster GIS images resulting
from interpolating the above vector point data. The apartment buildings
(vector points) as "source" data are overlain to give perspective.
Each of these images contain ~60,000 pixels, and each pixel has with a
"rent" value associated with it:
 |
 |
 |
 |
The above images can be used to develop trend-surface models. This will be explored further. Bookmark this site for updates.
Send email to me.
| All Contents Copyright. | |
| Last revised: 2000/JUL/12 |
Web Author: Allan
Krisciunas
|